Wednesday’s live session provided us with a powerful dose of knowledge, at the center of which was Bitcoin testing key levels in the shadow of growing tensions in the Middle East. As a crypto market analyst, I invite you to a detailed summary of the recent technical analysis of the most important cryptocurrencies and traditional markets.
Bitcoin acts like digital gold in the face of war
Yesterday evening clearly showed that the king of cryptocurrencies feels great in a high-risk environment.
Since the escalation of the conflict in Iran in early March, the price of Bitcoin has increased by 16 percent, approaching the ceiling of $75,000 on Wednesday.
Chart. Bitcoin rate (BTC/USD)

From a technical analysis perspective, we are now in a massive supply zone.
This movement looks extremely healthy, but data indicates that we may see a so-called dead cat bounce before long-term gains. This may be the current soffit.
There is a good chance of a deeper correction to collect liquidity from lower levels. Personally, I approach the current situation with great caution, securing profitable positions and waiting for developments.
If the bulls manage to break the USD 80,000 barrier and defend this area, it will be a strong signal to re-enter the market.
Commodity volatility and the strength of the S&P 500
To understand the situation in the crypto world, we need to look at the broader market context after the outbreak of the war in Iran.
Gold, which traditionally gains in times of global unrest, is now showing clear signs of weakness, drawing a double top pattern on the daily chart.
Chart. Gold rate (XAU/USD)

This suggests a possible decline in the value of this precious metal, which paradoxically would be great news for our market, meaning a potential inflow of capital into digital assets.
Crude oil, after the initial growth gap caused by reports from the front, continues its upward movement. The price of fuel at gas stations has already increased by an average of 60 cents per liter.
Chart. Brent crude oil futures rate

Rapid policy interventions from the US have analysts expecting black gold to return to lower levels by the end of March.
In turn, the American S&P 500 index seems to completely ignore geopolitical volatility. The chart looks very bullish, and the rapid retraction of the declines from the beginning of the week suggests a further march towards the historical peak, i.e. the level of 7,000 points.
Chart. S&P500 index price

Altcoin selection requires patience
A strong S&P 500 usually supports risky assets, which can be seen even in the chart of memecoin SPX, which builds a solid pro-growth candle after a precise support test.
Chart. SPX6900 token price

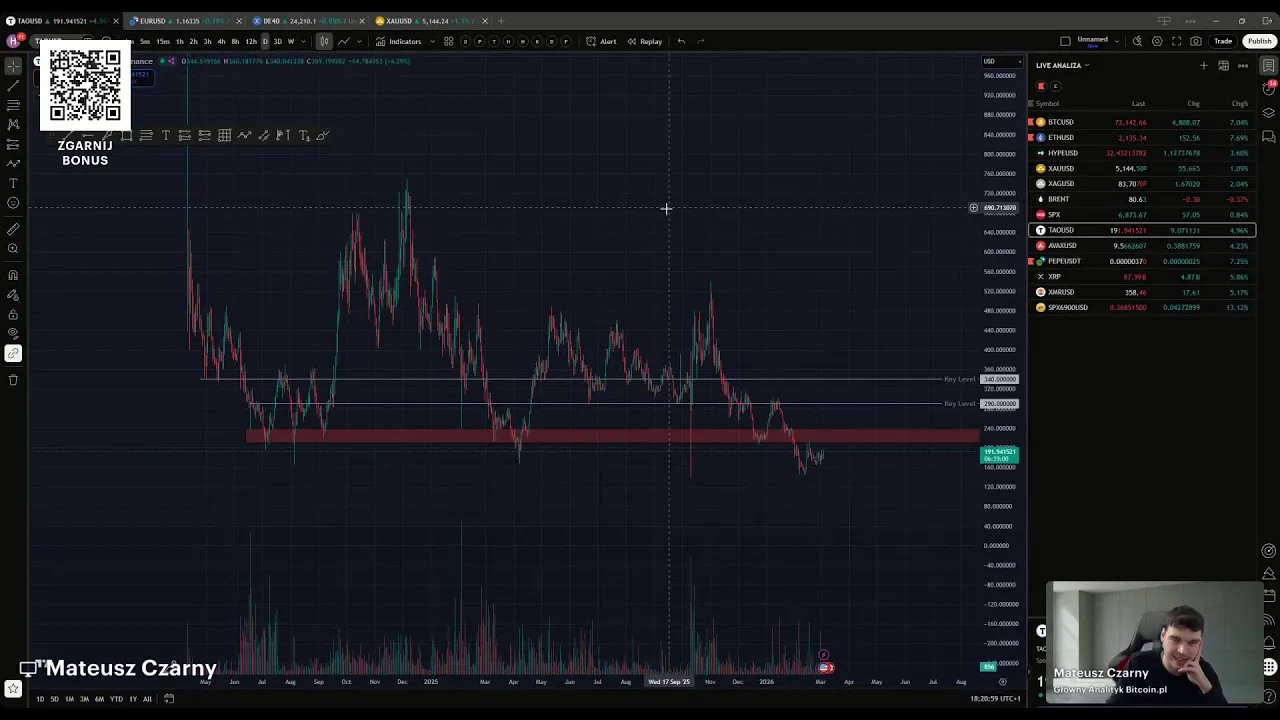
I am definitely less optimistic about the TAO token, which is popular in our community. The chart is currently showing a very significant weakening relative to ATH, and the project seems unattractive at this point from the point of view of AT and even the narrative itself in a market that is currently difficult for everyone.
Chart. Bittensor token rate (TAO)

The first significant resistance is located between USD 210 and USD 240, while the absolutely key supply zone lies between USD 290 and USD 340.
Rebuilding a healthy growth structure for this asset will likely take the next months.
Finally, let’s take a look at the Ripple token (XRP).
Chart. Ripple token price (XRP)

Instead of a standard price chart, I did a market capitalization analysis in this case.
This chart has defended a very important support zone in recent days, but I still suggest great caution in possible corrections and patient waiting for the final confirmation of the buyers’ strength.